Advertiser Performance Over Time
From Wiki
Performance over Time
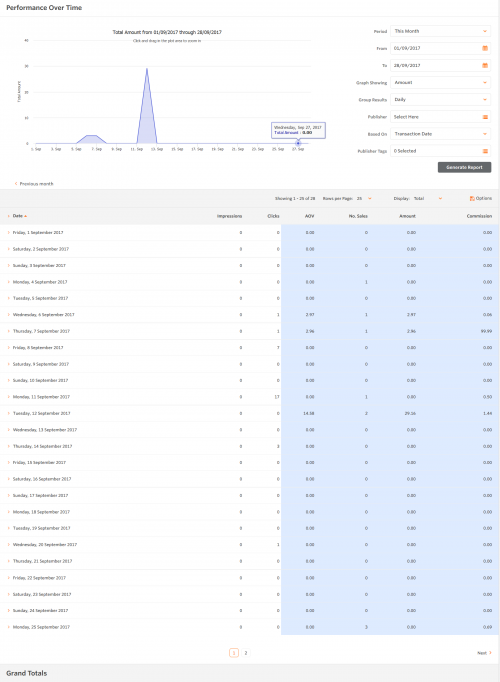
The Performance over Time report details a advertiser’s performance over a set time period. The information and graph generated are useful for identifying long-term trends in performance as well as assessing the results of any short-term trials and promotions that have been run. The report can be manipulated in many ways, which includes showing information for a particular publisher (as opposed to all publishers on the programme).
Report Options
| Period | This option allows you to select a specific date period such as Quarter To Date or Last Year to save time |
| From | This option defines the start date of your report |
| To | This option defines the end date of your report |
| Graph Showing | This option allows you to choose the data on which the graph is based on such as clicks or commission |
| Group Results | This option defines how the data for the report will be grouped and displayed. For example, the results can be can be grouped to show the data daily, monthly or yearly to allow for quicker comparisons. |
| Affiliate Filter | This option allows you to filter the results by particular publishers (maximum 25) |
Column Headings
The table can be sorted into ascending or descending order by clicking on any of the column headings. Below is brief explanation of each column:
| Date | This column in the table shows the dates during which the transactions displayed took place |
| Imp. | This column specifies the number of impressions that have been generated for the advertiser on that specific date |
| Clicks | This column specifies the number of clicks that have been referred to the advertiser site on a given date |
| Quantity | This column specifies the number of transactions that have been driven by publishers to the advertiser site |
| Amount | This column specifies the sales value of transactions driven for the advertiser |
| Commission | This column specifies the amount of commission accrued as a result of the sales driven |

